How Soil Sampling Helps Farmers Determine Their Needs

If your fertilizer bill keeps growing while your yields remain stuck, the issue might not be your seed or equipment; it could be your soil. Poor soil management is one of the most common reasons crops underperform, especially when you make input decisions without solid data.
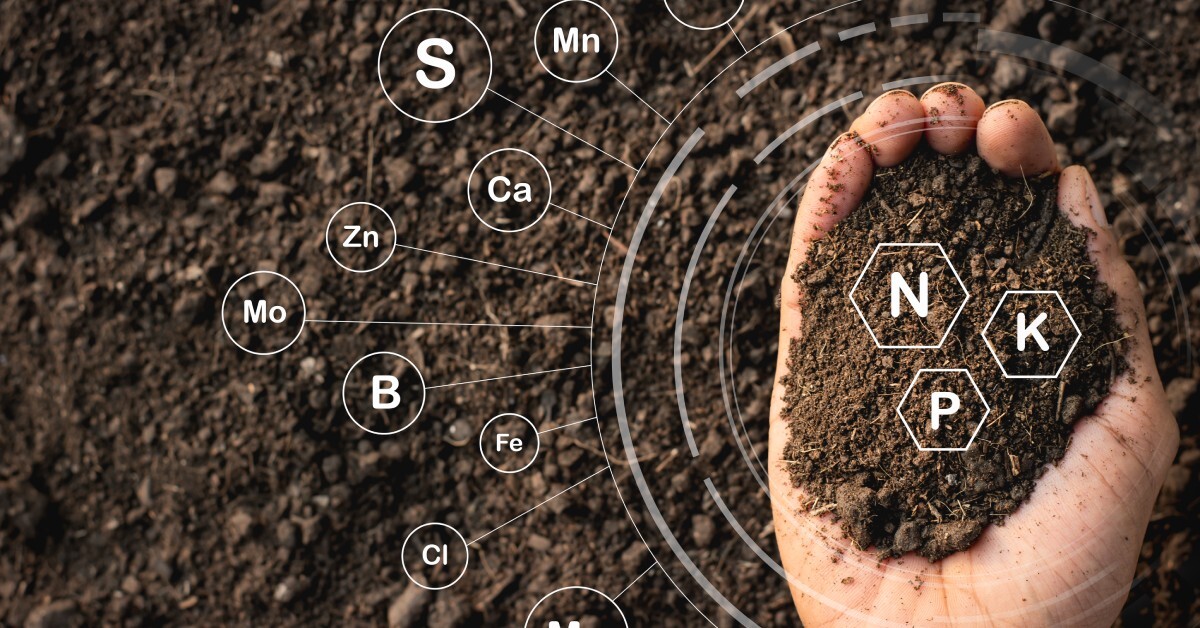
Soil testing gives you real answers about what’s going on beneath the surface. It reveals not only what’s missing but also what might be present in the wrong amounts. Understanding how soil sampling helps farmers determine their needs is essential to making smart, profitable decisions. Let’s look at what your soil can tell you.
Revealing pH Imbalances
Soil pH is one of the most overlooked variables in crop health, yet it has a direct effect on whether your crops can access the nutrients you apply. When pH dips below 6.0, it can tie up phosphorus, potassium, and other key macronutrients. This means you may end up wasting your investment in fertilizer, not because the nutrients aren’t there but because the plant can’t use them.
A pH imbalance also affects microbial activity in the soil, which is crucial for organic matter breakdown and nutrient cycling. Alkaline soils, on the other hand, can lead to micronutrient deficiencies, including in iron and manganese.
If your test results indicate acidity below 6.0, plan to apply agricultural lime in the fall at a rate determined by the buffer pH. That timing allows the lime to break down and adjust the pH before the next growing season.
Assessing Macronutrient Levels
Phosphorus, potassium, and nitrogen are the three major nutrients plants need to grow, and soil tests determine how much of each remains in the soil post-harvest. Phosphorus supports root development, while potassium regulates water uptake and plant stress. Low levels can seriously limit yields, even if other inputs are optimal.
Unlike phosphorus and potassium, nitrogen isn’t typically measured directly in routine soil tests. Instead, farmers estimate nitrogen needs using yield goals, organic matter percentages, and the nutrient removal rate of the previous crop. For example, corn following soybeans may require 30 to 60 pounds more nitrogen per acre.
Depending on what your report shows, a targeted application of diammonium phosphate (DAP) or potassium sulfate (SOP) can address these shortfalls more efficiently than broad-spectrum fertilizers.
Identifying Micronutrient Deficiencies
Micronutrients don’t get the same attention as nitrogen or phosphorus, but deficiencies can quietly reduce yields and crop quality. Boron, iron, zinc, and manganese are essential for enzyme production, cell wall development, and pollination. A lack of boron, for instance, can cause hollow stems in alfalfa or poor kernel fill in corn.
Micronutrient availability can vary not only by soil type but also by pH. For example, zinc becomes less available in high-pH soils, a challenge common in heavily limed fields.
If your soil test flags low micronutrient levels, the fix depends on timing. For quick correction, apply a chelated foliar spray two to four weeks after crop emergence. This bypasses the soil entirely and delivers nutrients directly through the leaves.
Understanding Organic Matter Levels
Organic matter is the backbone of a healthy soil profile. It improves water retention, enhances microbial life, and provides a steady nutrient supply as it decomposes. Soil test results showing organic matter below 2.0 percent usually point to a history of aggressive tillage, erosion, or poor residue management.
Boosting organic matter takes time, but small increases—0.5 percent over three years—can make a measurable difference in yield and soil structure. Incorporating cover crops like cereal rye or crimson clover after harvest helps build biomass and protect bare soil over winter. Reducing fall tillage passes also preserves soil aggregates and minimizes erosion risk.
Tracking Cation Exchange Capacity (CEC)
Cation exchange capacity (CEC) measures how well your soil can hold on to positively charged nutrient ions like sodium, calcium, magnesium, and potassium. A higher CEC means your soil acts like a stronger sponge; it holds nutrients longer and releases them more slowly to the plants. Sandy soils typically have a lower CEC, while soils with higher clay or organic matter tend to retain nutrients better.
If your test shows a CEC below 10 meq/100 g, your nutrients are more likely to leach out after rainfall. That doesn’t mean fertilizing is pointless; it just means you’ll need to split your applications.
Instead of applying a full dose of nitrogen in early spring, consider breaking it up into two or three smaller applications spaced three to four weeks apart. Over time, building up organic matter with compost, manure, or reduced tillage can slowly increase your soil’s CEC and its resilience.
Uncovering Compaction Risks
Compacted soil doesn’t just make for a rough ride across the field; it limits root development, restricts oxygen flow, and slows water infiltration. While you can’t diagnose compaction with a soil test alone, low organic matter and higher-than-expected bulk density results are red flags. These generally show up in areas with repeated equipment traffic or where shallow tillage is the norm.
You can confirm these zones with a penetrometer or by digging profile pits to examine root depth and structure. If you confirm compaction, the best time to act is in the fall. When soils are dry, a deep ripper can break up hardpan layers without causing smearing or further compaction.
Focus only on the areas that need it. Over-ripping healthy soil can create more problems than it solves.

Highlighting Drainage or Moisture Issues
Soil test maps can offer subtle clues about drainage challenges, particularly when certain nutrients—like sodium or sulfur—appear in high concentrations in specific zones. Uneven nutrient levels or salt accumulation may indicate that water isn’t moving through the profile as it should. These pockets of poor drainage can reduce nutrient uptake and stunt crop growth.
If the problem persists year over year, consider upgrading the drainage infrastructure. Installing tile drainage in wet zones or adding surface ditches can dramatically improve water flow.
For lighter touch options, raised bed planting in the spring may be enough to help roots stay above pooling zones in poorly drained fields. Either way, addressing these issues can prevent yield loss and reduce the risk of disease.
Comparing Management Zones
Not all parts of a field behave the same, and soil sampling doesn’t need to treat them as if they do. Grid or zone sampling breaks the field into smaller sections, allowing farmers to see how nutrient levels, organic matter, or pH vary across the landscape. Differences are often tied to slope, previous land use, or even decades-old manure applications.
When one zone tests at luxury levels while another comes back deficient, it’s time to rethink your fertilizer strategy. Variable-rate technology (VRT) allows farmers to fine-tune inputs, so one part of the field gets exactly what it needs, while another gets less or nothing at all.
Understanding how soil sampling helps farmers determine their needs comes down to intent. A soil test can tell you what’s present and what’s missing, but only if you’re asking the right questions and using the right tools. We offer a wide range of soil sampling tools designed to deliver accurate, repeatable results season after season. Let’s make every acre count.
Recent Posts
-
Soil Vapor Probe Installation Drive Tip Designs
 Precision matters in soil vapor intrusion investigations. The quality of the data shapes risk assess …February 26, 2026
 -
Bucket Auger Applications for High-Moisture Soils
 Geotechnical and environmental sampling brings unpredictable field conditions, and saturated soils c …January 16, 2026
 -
Why Sediment Sampling Is Important in Land Conservation
 When it comes to land conservation, the decisions we make today shape the future of our natural spac …January 12, 2026